As traders, one thing we love to do is trade. I am not trying to be glib but the thing that we love to do can also be a curse. Let me explain.
Trading is nothing like any other job out there. If someone that works in an office shows up for work and just sits at their desks surfing Facebook, they still get paid. Maybe not for long, but they get paid. Other jobs are no different. You punch in, do what you do, go home and at the end of the pay period, you get paid. Trading is nothing like that. There can be days where you sit at your desk and perhaps due to mega news releases or big money waiting on news, you don’t trade. No trading equals no money lost or won. This simple fact can lead traders to do some things that do nothing but drain your account. In the quest to lay down a trade, some traders get tunnel vision and only look at the charts they are trading, and that can be a huge mistake.
There is a very simple action you can take that will not only increase the chance of taking winning trades, but can also keep you out of a loser. Check out the higher time frame charts especially the daily/weekly to see if there is something in the way.
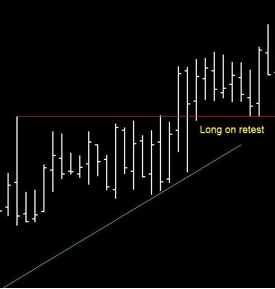
This chart shows a pretty common trading strategy. We are in an uptrend as shown by the green line. The red line shows a resistance level that is broken and this strategy goes long on a retest of the resistance level, which we are thinking, will turn into support. In this case, the level holds and we are off to the races. Price rallies and puts us up about 15 pips!
There is a problem though. Higher timeframe charts hold a ton of weight. A daily chart, for example, will give traders a lot of time to notice a rejection of the highs. Keeping to technical trading theory, these same trades will place pending orders to short the market when price reaches that level. Above that, they will place their stops. As sure as the sun will rise in the morning, this is a given. A few things can happen at this level when price comes back. Price can be rejected right at the level, can pierce through to take the stops and then fall or blow right through it. You never know what will happen so the more conservative approach is to think that the price will be rejected at that level and you will never buy into these higher timeframe levels.
CHECK THE HIGHER TIMEFRAME LEVELS FOR ROADBLOCKS!
Here is the daily chart of the same instrument:
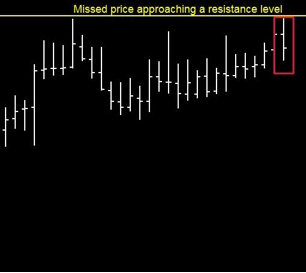
In your excitement to get into a trade, you bought right into a resistance level as noted by the red square. Price then dropped over 70 pips! If you would have checked the higher chart, you would have been able to filter even the best trade signal because at these levels, price usually has a reaction in the opposite direction as the orders at the level get absorbed.
Using a basic technical analysis tool, the horizontal line at support/resistance on higher timeframe charts, you increase the odds that you are getting into a trade with potential. It is a simple strategy that can keep your account from churning into a downward spiral.
A SYSTEM IN ITSELF
The practice of checking higher timeframes is not simply reserved for finding roadblocks. One great thing about higher timeframe levels is that many people can see them. When we look at a daily chart, it is a 100% probability that other traders can see the same levels. What does that mean for you? If we break it down into different outcomes, this is what we can assume:
- Traders will be looking for breakouts
- Traders will be looking to fade the initial move
- Trades will be looking to trade the first pullback after level break
The longer timeframe charts hold a lot of weight for the simple fact that unlike a five minute chart, these levels are “in the public eye” for a length of time that is long enough to be noticed and acted upon.
Let’s dissect the following chart for a great example of the points I mentioned:
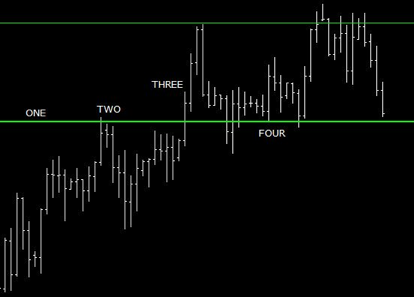
Item “one” is a previous day high that stood out. You want the levels that are obvious because if you have to hunt for them, the odds decrease on the number of other traders that see them. This level was a high that rejected a move up and sent the currency down 753 pips. It was THAT obvious.
Item “two” are the faders. These traders are the ones that look to fade these big levels. In this case, price dropped over 260 pips. A breakout trader may/may not have been taken into this trade as that depends on how much the price breaks out. If they look to trade breakouts one pip beyond the key level, often times they are victims of stop hunts by the bigger players. A pullback trader would have not been in that trade. The move into this level is another tactic you can use at these levels that is beyond the scope of this article but does provide some high probability trades.
Item “three” is the breakout traders that caught the explosion out that went 226 pips. Many breakout traders have a strategy to know which ones have a higher probability of succeeding. That is an option you can explore if breakout trading is to your liking.
Item “four” are the pullback traders. They love to wait if/until price returns to the level for a resumption of the move. Many times, when price returns to the level, pullback traders will drop down to a lower timeframe for a lower risk area to enter. Price moved over 200 pips from the previous level however by dropping down to a lower timeframe, many pullback traders got a better price with lower risk.
Trading is personal
There are many ways to trade, and anybody who tries to sell you the grail is dishonest. This article shows that whatever strategy you use, there are ways to increase your odds by simply using higher timeframes to check roadblocks. That leads to a strategy that uses only price structure and tactics that can advance your trading career and is based on sound market principles. Take some time this weekend to go over some historical charts to see if this is something that fits you as a trader.