Candlestick charts are perhaps the most widely used format for tracking the historical prices of stocks, commodities, cryptocurrencies like hodl token, and pretty much anything else that you can trade. They are simple to understand and they have an advantage over bar charts because of the colored solid bodies. The convention for coloring up candlesticks green and down candlesticks red helps to develop a more vivid picture of historical price action. But apart from simply using it to track the historical price of a product, how does candlestick charting help you invest smarter?
Building blocks
Candlestick charts provide you, if you know how, with a means to understand what the market has recently done and what it is therefore likely to do in the future. Candlesticks provide the building blocks to understand the implications of price change.
Price change
The change in price of a market is the first and most obvious way a candlestick chart can help you in your investing decisions – however, many other different types of charts also do a good job at this so it’s not fair to say that candlestick charts are better in this way.
Single candlesticks
Individual candlesticks can be very informative in showing you what market participants are trying to do. This is largely because of the wicks or shadows. These are the thin lines that often protrude beyond the main colored body of the candlestick. They show you where the market has been and returned to. A large wick for example, indicates a test of an extreme in price followed by a decent amount of interest that was strong enough to return prices back or close to where they came from. This might in some scenarios, suggest that prices are set to continue in the direction of the reversal.
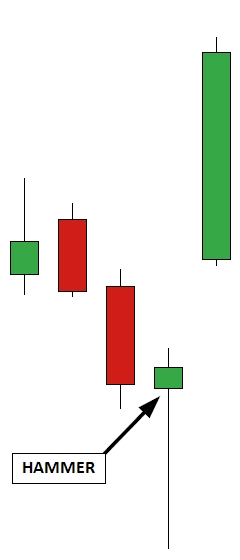
The Hammer candlestick has a long lower wick and can appear after a decline in prices – it indicates a possible imminent reversal in prices to the up side.
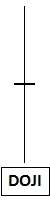
The Doji candlestick has wicks both above and below with a thin body as price closes at or around the opening price – it suggests indecision from market participants.
Candlestick patterns
Candlestick patterns can be powerful indications of imminent direction if used correctly. Patterns made clear by patterns such as harami, engulfing or piercing patterns can give strong indications of the directional intent of a market, especially when coupled with contextual information.
Entry timing
Having specific investing criteria can help you to identify individual stocks that over time, have the potential to move favorably. But the trouble is that this sort of process doesn’t always take entry timing into account and therefore an investor can see a position fall under water before things start to work out.
By looking for candlesticks and candlestick patterns that are sympathetic to your trade direction, it’s far easier to get your position in the black sooner.
Trade a long term position
Rarely does any market in the world move in a single direction without any pullbacks. Because of this, it’s not unusual to find investors trading a long term position. When candlesticks are giving early warning signs that a market is about to reverse, there’s a potential opportunity to take off at least a portion of a position and look to reestablish it at better prices instead of holding through a drawdown. In some circumstances, it might even be possible to reverse the position temporarily. If you are thinking about trading cryptocurrency, crypto trading bots are a great way to automate your cryptocurrency investments and manage risk by creating rules for making trades. Check out this cradio review to learn more about it.
A final word of caution
Candlesticks can help create or give credence to existing hypotheses of what is going to happen next. However, the goal of any technical analysis is to tip the odds in your favor. Charting of any kind is not foolproof and does not guarantee when you see something happen, it will always lead to something else. Seeing a shooting star doesn’t mean you’ll see a fall in prices soon – it means that there’s been some significant selling at recent highs. If this ties in with other factors, it may mean that there’s a strong chance of a drop. But ultimately, you can’t know what will happen next and who will step into the market to move prices in the future.