by Will Feibel
One of the best known chart patterns is the head and shoulders pattern. The pattern is formed at the end of a trend and signals a reversal in direction. Its name is based on its resemblance to the outline of a head and shoulders, three peaks with the middle one being the highest, as seen in Figure 1.
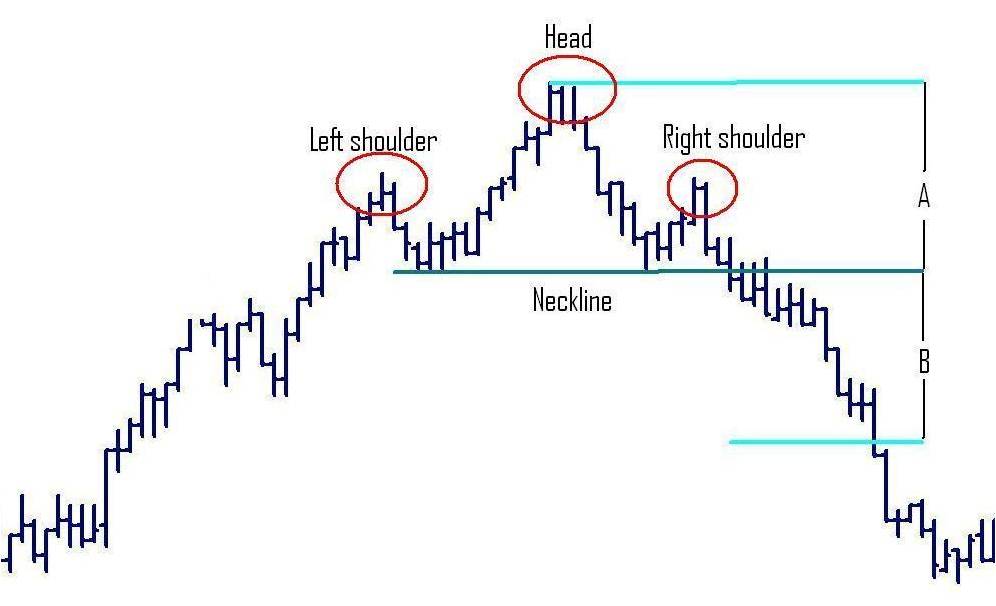
Figure 1
As you can see the tall peak in the middle (the head) is flanked by two smaller peaks (the shoulders). Extending the comparison we have the fourth feature of the pattern, the neckline, formed by drawing a line between the two depressions between the shoulders and the head.
Classical technical analysis defines an uptrend as a series of higher highs and higher lows. This is what we see in Figure 1, a clear uptrend culminating in the head of the pattern. The right shoulder suggests a weakening of this uptrend because it is the first lower high in the chart. This weakening is further indicated by a new low at the right neckline that is just barely higher, or the same, as the prior low. The pattern of higher highs and higher lows is breaking down and suggests that the uptrend is coming to an end. When a trend ends it will inevitably be followed by either a sideways price consolidation or by a trend reversal. In the case of a head and shoulders pattern the reversal is signaled by price breaking through the neckline.
The neckline of the pattern represents a level of resistance to a downward move in price. Think of it as a resistance level formed by the double bottom inside the head and shoulders formation. Once this resistance level is broken to the downside it becomes support for the downtrend and you will often see price retrace to the neckline before resuming the downtrend. The neckline also helps us project the size of the move down. This is done by measuring the distance from the top of the head to the neckline. This distance is then subtracted from the neckline where price breaks through it to give us a minimum target for the move down. In Figure 1 the distance between the head and neckline is denoted as A and this is projected down as B which you’ll see was easily reached in the reversing move.
The head and shoulders pattern is often further confirmed by volume. The left shoulder will typically have strong volume, while the volume at the head will be lower because the uptrend is weakening. The volume at the right shoulder will be weaker still signaling an end to the trend while the break through the neckline will come on strong volume. This volume pattern is a secondary confirmation however and will not always be there. Rely on the formation of the pattern and the breaking of the neckline to indicate the reversal.
So far we have only discussed the head and shoulders pattern as indicating a reversal from an uptrend to a downtrend. There is also an opposing pattern, the inverse head and shoulders pattern that signals a reversal from a downtrend to an uptrend, and you could even see alternating patterns within a larger time frame consolidation. Figure 2 shows an example of this.
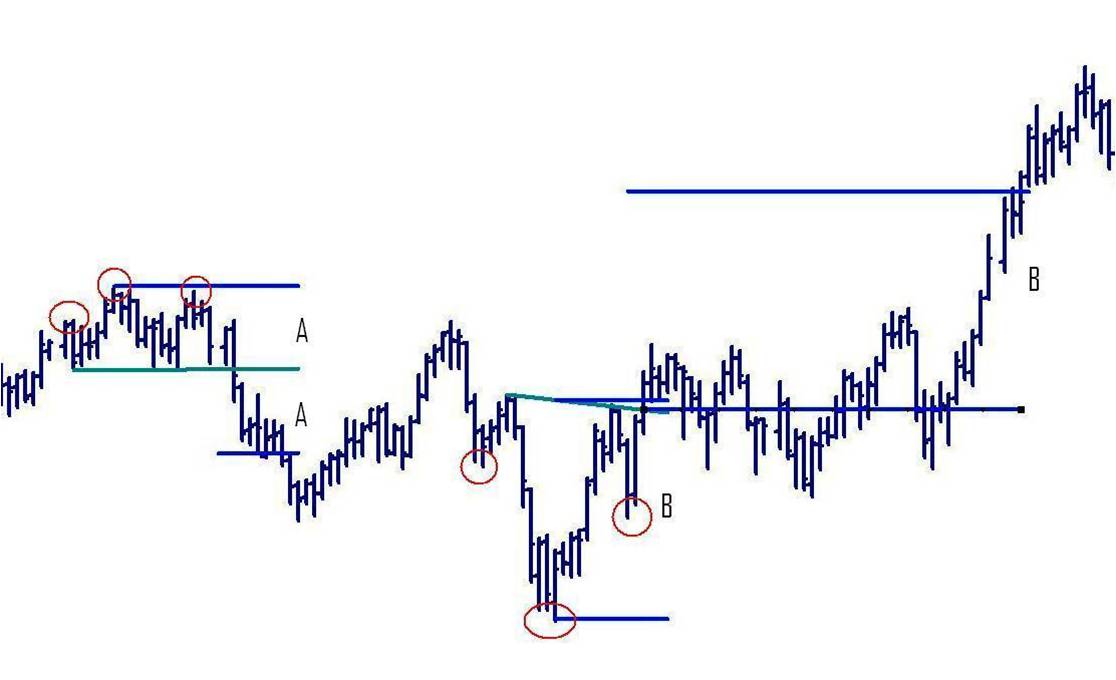
Figure 2
In Figure 2 we have a head and shoulders pattern that is broken to the downside and gives us a target A once the neckline is broken. Price actually retraces to retest the neckline before resuming its downtrend. The downtrend doesn’t last long before an inverse head and shoulders is formed. This is broken to the upside and measuring the distance from the head to the neckline gives us a target of B, which again is reached after a few tests of the neckline.
Like all technical analysis patterns the head and shoulder will not always precede a reversal. The pattern can also fail and we typically consider it failed if price breaks above the right shoulder. When that happens we will most likely have entered a consolidation or resumed the uptrend. The latter would be confirmed by a price break above the top of the head, similarly for the inverse head and shoulders.
It can be difficult at times to spot head and shoulders patterns on a chart, usually because we look for them in the wrong places. You will only find these patterns at the end of a trend so don’t bother looking for them during a price consolidation or in very choppy markets, make sure that there was a clear pattern of higher highs and higher lows first. Also, don’t force it, don’t squint too hard or try to finesse it too much. When the pattern is there it will be very clear, as in Figures 1 and 2. Reversals can also be indicated by other technical patterns so don’t assume you’ll find a head and shoulders at every reversal.
Exercise your eyes and mind and start looking for head and shoulder patterns on your charts. Once you spot them make your target projections and see how often they are hit. You may find that this pattern can be a profitable addition to your trading toolkit or at least provide a strong confirmation for reversals signaled by your current system. Good luck in your trading.