It’s difficult to read anything about trading without reading about the myriad of Forex indicators available on most trading platforms. It can often make it seem that the only way to trade is to load up your chart with multiple indicators and attempt to decipher the meaning behind each one.
Then your job is to make a trading decision on the information that is sometimes conflicting.
Trading does not have to be that complex.
I want to make this article much different than the ones you usually read about trading indicators.
I personally don’t base my trading on indicator readings alone but I do respect a few of the tools that are available to any Forex trader. Price action, structure, and the odd indicator can however be combined to assess the market condition you are facing.
3 Points about Forex Indicators
First, let’s covers three points about indicators in relation to the Forex market. Remember, the retail Forex market does not trade at a central exchange so any volume based indicator will not be reliable and will not be covered in this article.
Some may disagree with my comments however in my years of trading; I have seen limited usage for indicators as the basis for a trade plan. Used in conjunction with simple concepts of the market however, a few indicators can a serve a purpose for the task of clarity. Few traders will ever find success by jumping between indicators or thinking there is a magical combination that will unlock trading riches.
- Leading or Lagging. Indicators are based on the past price of the currency pair you are charting which would make indicators lagging as in “they lag current price”. Indicators need prices to calculate the reading. Many people will disagree and state that oscillators do have a predictive quality and point to overbought and oversold conditions.
The problem is that an indicator such as RSI (relative strength index) can enter the oversold condition and stay there for months.
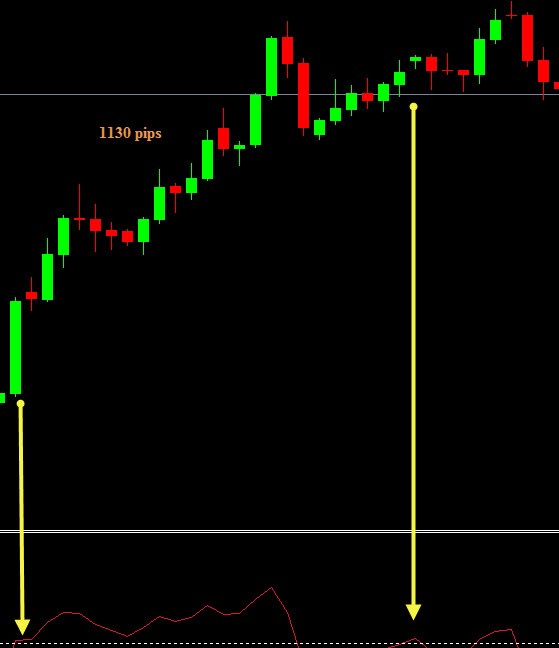
This chart shows a daily chart of the EURJPY and you can see where the 14 period RSI travels into overbought condition. It still travelled over 1000 pips giving several opportunities intra-day to short this market.
You can imagine that when price broke hard in the middle of the chart, many traders piled into the short only to have price re-enter overbought and squeeze them out of their position.
If you were to hold the opinion that indicators are all lagging, you would not be tempted to use indicators as your primary trading tool without taking into account other aspects such as market structure.
- Momentum Indicators. This is one of the general categories that indicators fit into. These indicators, such as MACD, and ROC indicator, identify the speed or strength of price movement. They can be used to show potential weakening in price advancement over N number of days/weeks/months.
- Oversold/Overbought Indicators. Just like the name implies, these indicators such as Stochastic, range between set limits and when price reaches one of those levels, it shows that, potentially, the market is either oversold and perhaps buyers are waiting in the wings. It can also hint that the market is overbought and potential sellers, to gain positions and those looking to unwind their long positions may be ready to take action.
Moving Average Indicator
I guess no article would be complete about Forex indicators if we don’t mention the very popular moving average.
When discussing moving averages, you will read about different settings such as 20, 50, 34 and types, EMA, WMA, and SMA. Your question should be what makes one better than the other? Some will say institutions use them as buying points when price returns to it. It is extremely hard to substantiate that explanation regardless of the many trading “gurus” spouting it.
There are some benefits to using a moving average especially for a “quick glance” at the trend or state of the market.
This graphic here shows a 50 day moving average. If during trading scans for trending markets, you could quickly make a decision on this market.

- Price is trading under the average so you determine it is a downtrend
- The moving average is clearly slopping down so you determine a downtrend
This would help you to have some semblance of rules on your trading plan and keep you from trying to pick trend reversals as you play the trend.
You can also use the moving average to determine the state of the market.
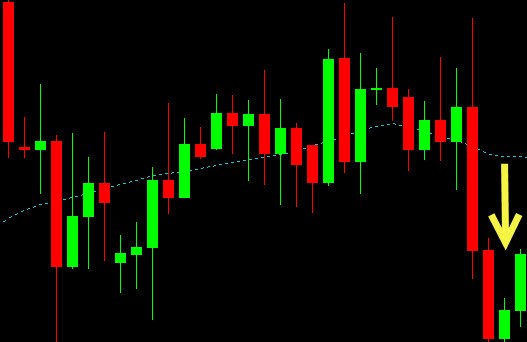
In this graphic above, price has pulled back to the moving average and has continued to bounce around both sides of it. There is clearly not a strong imbalance of buyers and sellers and this may be a market you stay away from until the yellow arrow area.
At the yellow area, price has broken away from the herd and started a descent of 480 pips. While this strong move away doesn’t automatically suggest a strong imbalance, without the move away there clearly is not an imbalance.
Shunned Most Forex Indicators
Like I mentioned earlier, most indicators, for me, serve a limited purpose in my trading. I like things kept to a minimum and much prefer to see what price is telling me backed up, at times, by an indicator.
This is certainly not to suggest that I find all uses of indicators a loser’s game.
There is a play that I am a huge fan of that combines a market extreme with price divergence, support/resistance, and a chart pattern. It is not meant to trade “trend reversals” (although it has caught large moves in the past), it is meant to grab one clean swing in the market.
Recognize Extremes
One of the first things I do is find out where a market extreme is. I don’t mean a previous swing level but an area where emotions look to be ruling the price moves. Usually, when you see a parabolic move, it indicates emotional extremes in the market.
You can use channels or even simple parallel trend lines and when price, in a long situation, is outside of the band, it indicates extremes.
The chart below is the EURJPY and is a trade that played out early in December 2014.
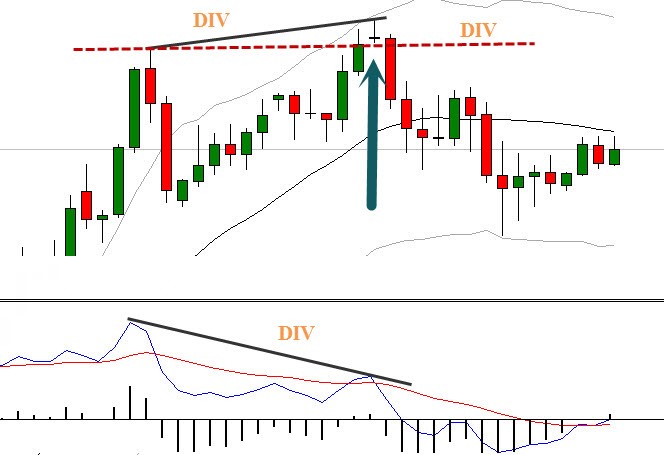
Price had been outside the channel for about two weeks. As you can see in the lower panel, the indicator (MACD) makes a high in price.
Price then does something it had not done in those two weeks….it pulls back into the bands and then rallies above that high but the MACD puts in a lower high. The failure of price to hold the high is the first thing I notice. The failure of the MACD is secondary to this play but it does confirm that that previous high may have been the peak of the “emotional extreme”.
Once price fails to hold, intra-day charts gave a decent entry and a travel on the capitulation of the market.
Are Forex Indicators For You?
You will have to ask yourself if any of the myriad of indicators available serve your trading needs. Keep in mind that many will give the same information and you certainly don’t want your trading chart to be covered in squiggly lines. You want to have a clear view of that which actually feeds the indicators information: Price itself.
A trading method that begins with the clarity of market action, structure, and taking trades only when an imbalance is prevalent is the proper foundation. Adding any indictor to your Forex trading should only be done when you fully understand the mechanics of the indicator and when it’s used as a confirming method and not a trading method.