We have all familiar with the saying, “Don’t put all your eggs in one basket.” This has long been good advice as a risk management technique for holding a variety of investments within a portfolio. The idea behind this technique is that a portfolio with different investments will on average yield higher returns with lower risk than any individual holding within the portfolio. The purpose of diversification is to smooth out the equity curves of the individual holdings so that the positive returns of some investments will help offset the negative returns of other investments.
With traditional buy-and-hold strategies, studies have shown that a well-diversified portfolio of approximately 25 to 30 stocks is ideal. This is large enough to take advantage of the risk-reducing benefits of smoothing equity curves, but small enough to be manageable. The benefits of portfolio diversification are maximized when the holdings are not correlated. In other words, it is best if the individual holdings represent different industries or sectors, and are influenced by different news events.
As traders, however, we often do not consider the benefits of diversification. We spend more energy in search of the Holy Grail of trading systems than we do in actually trying to maximize the potential of the trading the system or systems that we already have. Diversification actually offers us traders more options than investors have with buy-and-hold strategies. With traditional investing, diversification is basically limited to the risk management strategy of holding various long positions in a variety of investments (including cash), but with trading, we have the opportunity to take it much further. We can diversify by time horizon, charting interval, time frame, market, in addition to position size and direction (long or short).
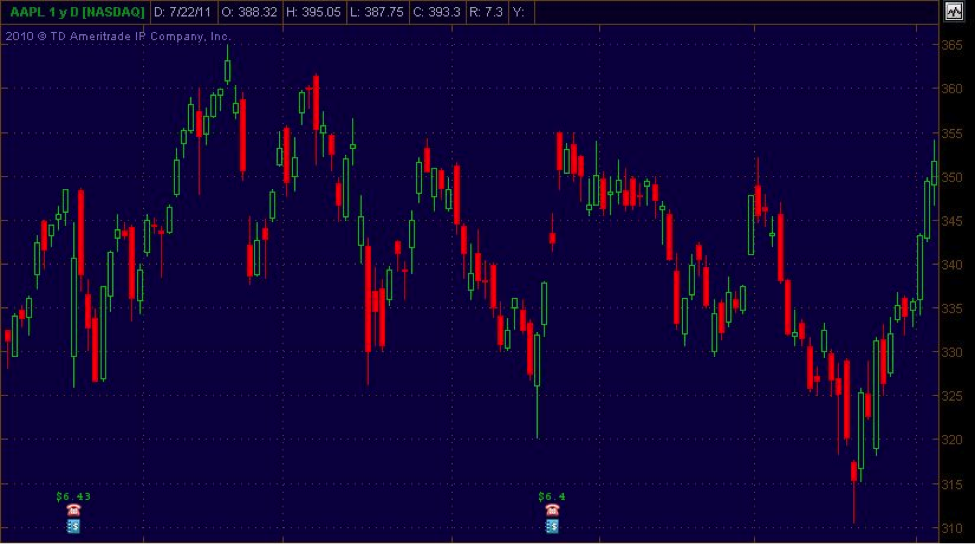
Traders often start out with short-term time horizons (day trading) and overlook the advantages of longer time horizons. By adding additional time horizons, a smoother equity curve can be obtained because there are opportunities for swing trading and position trading, even with the same security. The advantage of adding these other time horizons to the same security is that you are already familiar with how it trades, when there are earnings announcements, and how it reacts to various news events. The example below shows the different opportunities to trade Apple (AAPL) with different time horizons. The first chart shows a daily chart of AAPL for the first half of the year. If you hold positions for a long time, then this chart, with its slight bias to the upside, would provide some profits for long time horizon position trading.
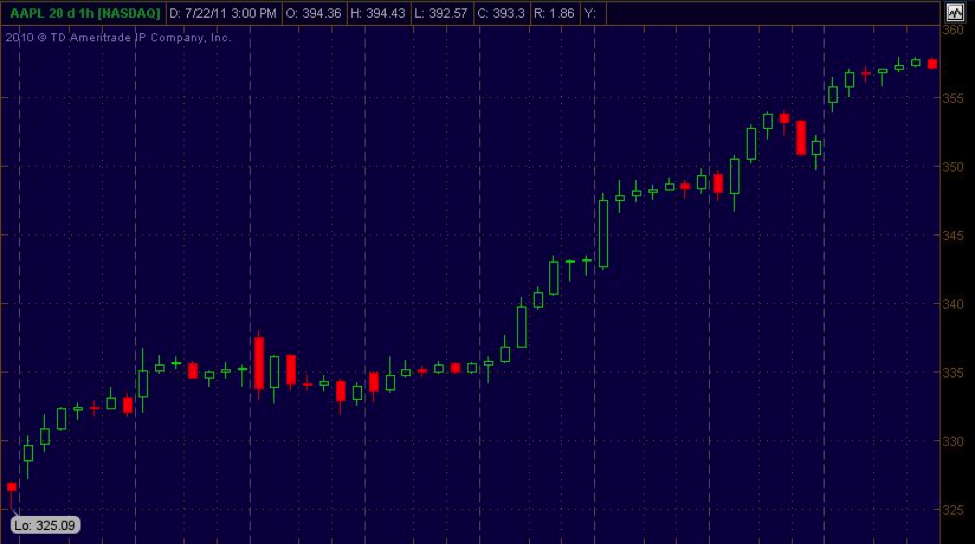
If we move to a smaller charting interval, we have the ability to add swing trading to our business. Figure 2 shows an hourly chart of AAPL towards the end of the time period above, and here we clearly see an opportunity for taking a long swing trade over a few days. Depending on your trading system, there is even an opportunity for an add-on trade within this time horizon.
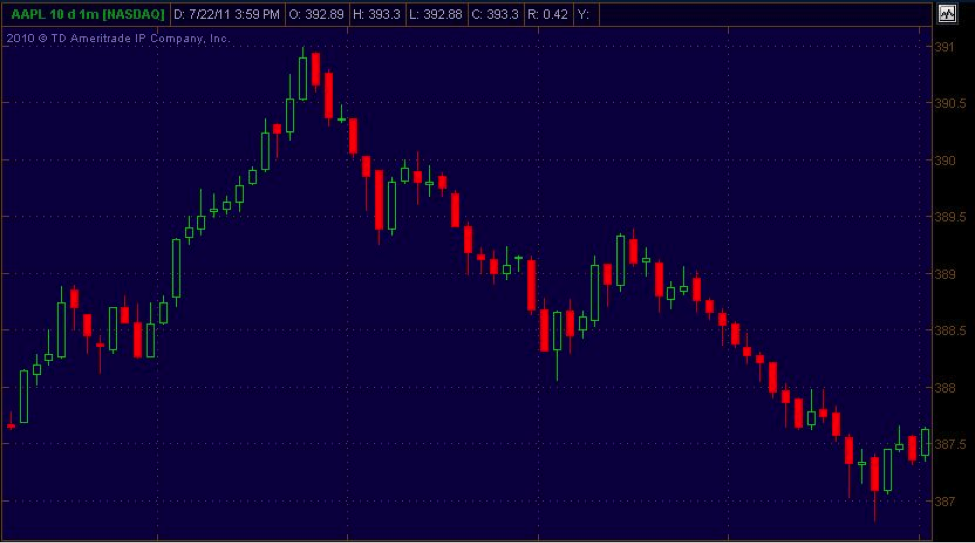
Finally, Figure 3 below shows a chart of AAPL with minute bars. This chart is taken from one of the days shown above, and provides us with multiple opportunities to profit from a day trading chart. Again, depending on your system, there are opportunities to go long or short and include add-on trades.
By considering multiple time horizons, even with the same instrument, we can diversify our trading, and thus smooth out our equity curve. We may be in a long trade for the longer horizon, but take long and short swing trades within that time period. One way to keep track of these trades is to set up either multiple brokerage accounts, or, as some brokers allow, sub-accounts within the same account.
The remaining methods of diversification will apply mostly to day trading, but may also be applicable to swing trading. If your schedule is flexible enough, you may consider adding other trading sessions. The three main sessions are the Asian session, European Session, and the U.S. session. Many traders pick only one session to trade, but if the instrument is actively traded in more than one session, then there is an opportunity to offset the losses in one session with winnings in another session. This can often result in a smoother equity curve.
We have already touched on time intervals, but you can also diversify with different charting intervals. Most brokers provide for the charting of different time intervals (weekly, daily, intraday, etc.), but many also provide charting of tick bars, volume bars, and range bars. By diversifying our trading by using different charting intervals, we tend to smooth out the impact of external events like news. Also, we can use different charting intervals to move away from the “crowd” by picking intervals unique to our trade plan (like a non-Fibonacci tick chart).
It is also worth diversifying your trading by picking different markets. If you only trade stocks, you may want to consider adding other markets, like stock options, Forex, or futures. If you trade only index futures, consider adding currency futures or commodity futures like the metals or agriculture. The goal is to add securities that are do not correlate with one another. This will have the biggest impact on smoothing your equity curve because there is a greater chance that drawdowns will not take place at the same time.
There are a couple of very good reasons for diversification. One is mathematical, and the other is psychological. Mathematically, diversification smoothens out an equity curve, provides more equity highs, and shorter draw down periods. (It also smoothens out the peaks so the flip side is you don’t get sudden spikes.) This occurs because equity curves from individual non-correlated securities will tend to combine in a way that creates a composite curve that is smoother and more stable. We can illustrate this by considering drawdown periods resulting from losing trades. Let’s say your trading system has a profit factor greater than one and a winning percentage of 65% for each trade. Through either back testing or live trading you discover that there is a very good chance that you can expect to have 5 losing trades in a row during a certain trading period (a month for example). This can sometimes be hard for the beginning trader to accept, and even though it has been back tested and there is a positive expectancy and a positive equity curve, the trader may be tempted to throw in the towel when this losing streak occurs and look for another system. By adding another security to the plan, however, the odds of this second security losing 5 trades in a row at the same time are reduced considerably. If the two securities are completely non-correlated, the odds are reduced to less that 1%, but practically speaking we can expect something around 5% or less. With the addition of each security, these losing periods are further reduced. As each security is added to the trade plan, the amount allocated to each position is also reduced, and the equity curve continues to smooth out. The best part of all is that this has the added benefit of providing a very positive impact on your trading psychology. Individual positions are smaller, thus individual losses are smaller, and net drawdowns are shorter. Now in addition to each trade being just one tree in your forest of trades, each security is just one tree in your portfolio.
If you are just starting out, you may want to consider adding a swing trading plan to your day trade plan. As you become more proficient, you can consider adding at most one or two day trade plans, and you may want to add more swing trade plans because they are easier to manage. Consider different markets or industries to achieve greater diversification. As you continue to diversify your trading business, you can expect to see a smoother total equity curve, which will do wonders for your trading psychology. With these results you just may have discovered the Holy Grail of trading.