In the last two articles we looked at TradeStation’s built in strategies and how to mix and match them to create simple custom systems. Another tool that we can use is the custom indicator functions. These custom functions do not create automated systems but they can be used to plot custom indicators and identify special conditions on the price chart.
TradeStation has three types of custom indicators, matching the three primary types of analysis technique:
- Custom indicators are used to plot numerical values on a chart based on a formula. This would be similar to indicators like moving averages or oscillators, except that you define the formula.
- Custom PaintBars are used to paint individual price bars when a certain condition is met. An example would be painting in blue any price bar that has a larger range than the seven preceding price bars.
- Custom ShowMe is similar to the custom PaintBar in that it identifies bars where certain conditions are met. Instead of painting the bar however, the custom ShowMe lets you specify where to place an identifying marker (typically a dot) on the chart. As an example you could use the custom ShowMe to plot a dot one average true range (ATR) above the high of the bar if the current bar has a higher close than the seven preceding bars.
In this article we’ll focus on the first of these, the custom indicator.
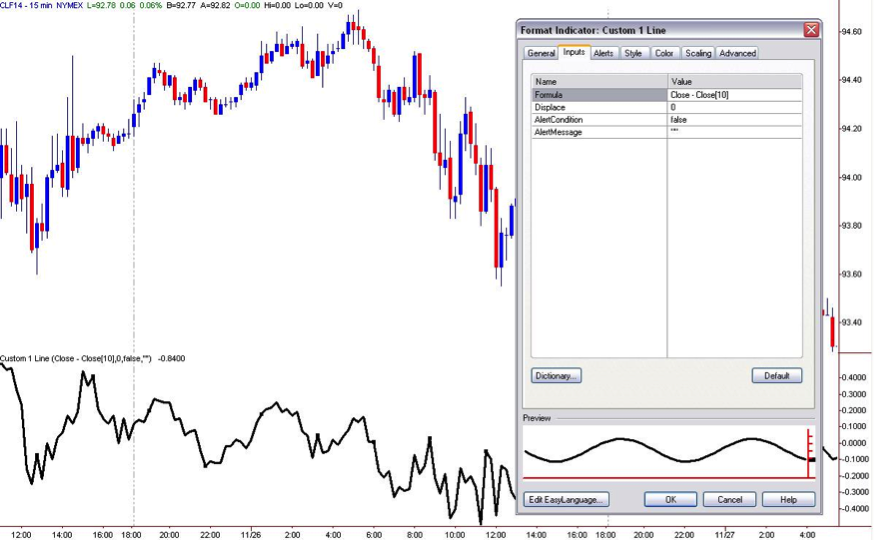
To use a custom indicator in TradeStation use the Insert/Indicator… menu and select the Indicator tab in the Insert Analysis Technique window. Scroll until you find the Custom 1 Line indicator and place that on your chart. Figure 1 shows the default inputs for the custom indicator and its plot. The key item in the inputs list is the Formula: Close – Close[10]. Let’s take a look at what the elements mean.
- Close is the closing price of the price bar used in the calculation. Close can also be abbreviated simply as C or c.
- Close[10] is the closing price from 10 bars prior. If you wanted to calculate the price of the prior bar you’d use Close[1], to plot the close from 5 bars ago you’d use Close[5]. Note that for the current bar you can use Close, as above, or Close[0], meaning the close from zero bars ago. You can also use the abbreviation C[10], C[5], C[0], c[10], c[5], or c[0].
The default formula input is therefore telling TradeStation to plot the difference between the close and the close from ten bars ago. This is actually the formula for the basic momentum indicator which you’ll notice if you overlay the built in Momentum indicator, with a period of 10, onto the same chart.
It’s easy to build additional indicators using a few of the other built in words. In addition to Close[n] you can also use Open[n], High[n], Low[n], and Range[0] for example, along with the simple arithmetic operators +, -, *, and / for addition, subtraction, multiplication, and division. Two other useful formulas that you can incorporate into your custom indicators are:
- Simple moving average function Average(Value, Period) where value is the number being averaged and Period is the length over which it is being averaged. For example Average(Close,20) will plot the 20 period simple moving average of the close.
- Exponential moving average function XAverage(Value, Period). This is similar to the above except that it will plot the exponential moving average.
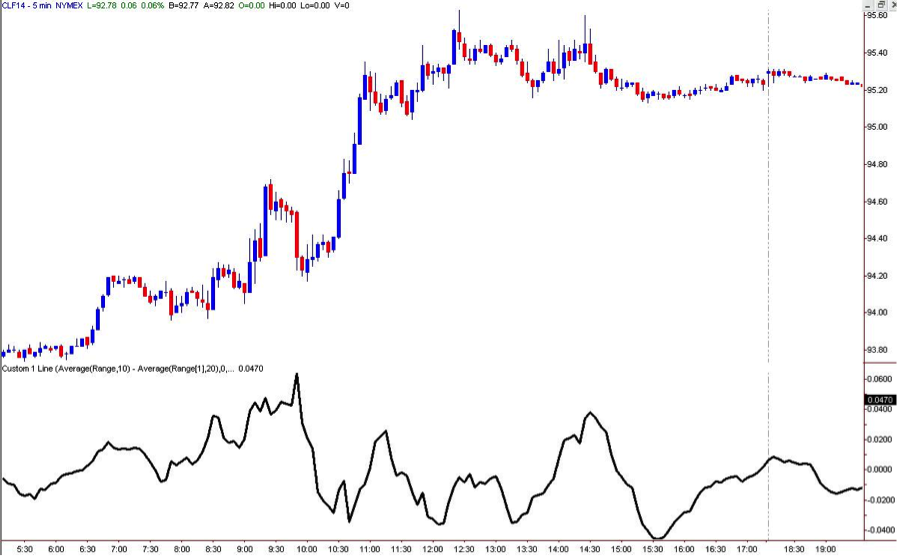
Let’s say you want to plot a simple indicator that compares the average range over the last ten bars to the average range over the last twenty bars. Maybe this can give you an indication of whether or not the market is entering a period of consolidation where the range would typically contract. The formula you could use is Average(Range,10) – Average(Range,20). If the result is a positive value then the recent range is greater than the longer-term range, and a negative value would indicate that the recent range is smaller than the longer-term range and the market is probably consolidating. Figure 2 shows the resulting custom indicator, and indeed it would appear that it’s positive during the more active early trading session and negative during the later morning session and lunchtime.
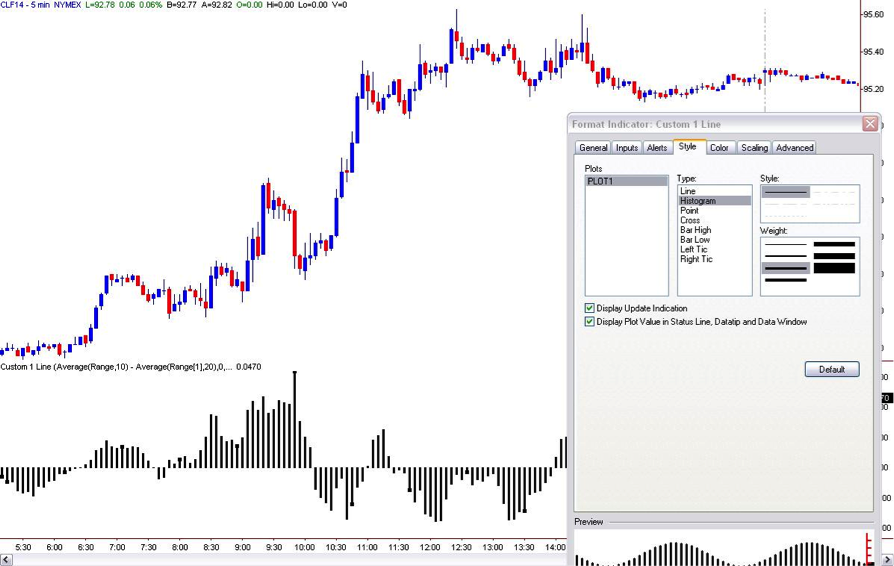
You can also change the style and color of your plots by using the built in features of all TradeStation indicators. You may decide that it will be easier to interpret the custom range expansion/contraction indicator if it’s plotted as a histogram. In that case simply open the Format Indicator window for the Custom 1 Line indicator and click on the Style tab. There you can change from the default line type graph to a histogram. Figure 3 shows how this will look. It’s still the same information but it’s easier to tell positive from negative values and you could even look at divergences between the price chart and the histogram.
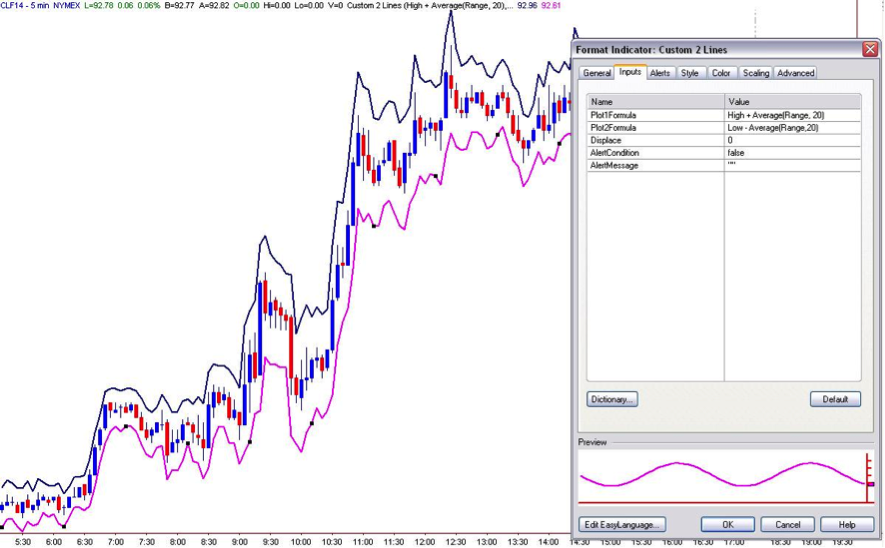
It is also possible to combine more than one indicator on a chart. You probably noticed that TradeStation also has Custom 2 Lines, Custom 3 Lines and Custom 4 Lines indicators, and they do exactly what you’d expect them to do, they plot two, three or four lines simultaneously. For example you could use the Custom 2 Lines to plot a channel that’s one average range above and one average range below the price bars as shown in Figure 4.
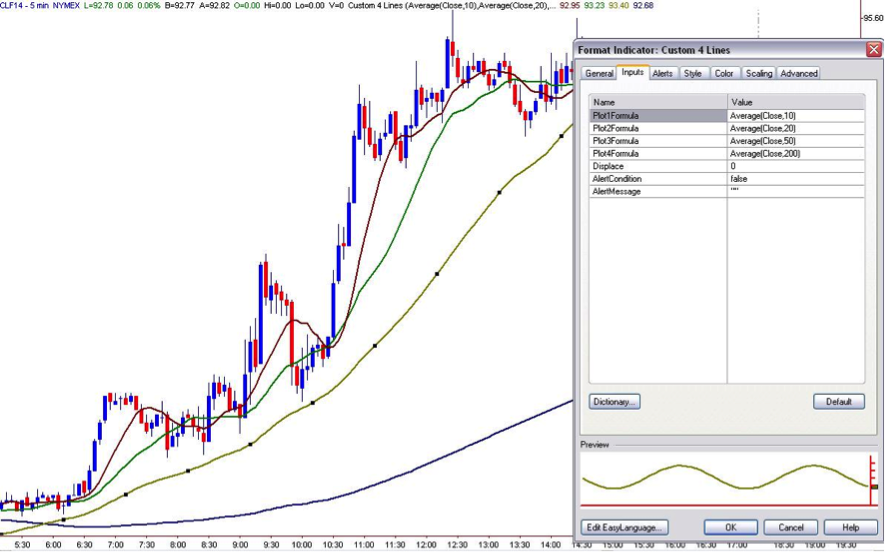
Or perhaps you’d like to plot a set of four moving averages to help determine the direction and strength of the trend. Figure 5 shows how to do that with the Custom 4 Lines indicator.
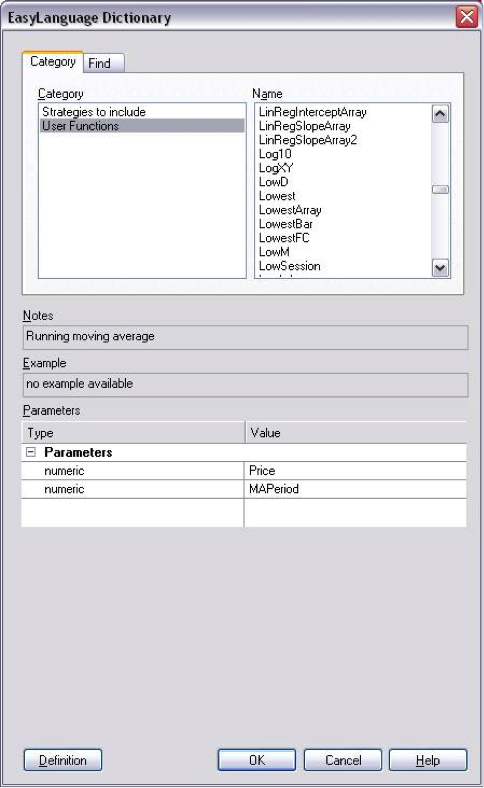
You can create some very sophisticated indicators by harnessing the power of built in functions available in TradeStation. To learn more about what’s available, click on the Dictionary button in the Inputs tab of the indicator that will open up the EasyLanguage Dictionary window. In that window click on the Category tab and select User Functions in the Category window. From there you can scroll through all of the functions that could be incorporated into the custom indicator, with more help available through the Definition button. Figure 6 shows how the Dictionary window looks.
Don’t be afraid to experiment. You can’t break TradeStation by using the custom indicators, worst case you’ll make a mistake in the inputs and get an error message. It’s a terrific way to quickly test out ideas both historically and real time in the market. Once you have fleshed out and tested your ideas you can then go the next step and create a program that incorporates them. So go ahead and put your ideas to the test!